Here’s a tip: if your team has just completed a stack of research and are about to release a report, spend a little cash to have your results turned into an infographic. Personally, I love infographics. They’re a visually appetizing way to consume what might otherwise be confusing or inaccessible data.
Here are five of my favorites. Each one examines a different aspect of becoming more productive.
5 Ways to Be More Productive
Great summary of a number of different tactics. Including Brian Tracy’s famous “Eat That Frog!” and the research-backed Pomodoro Technique.

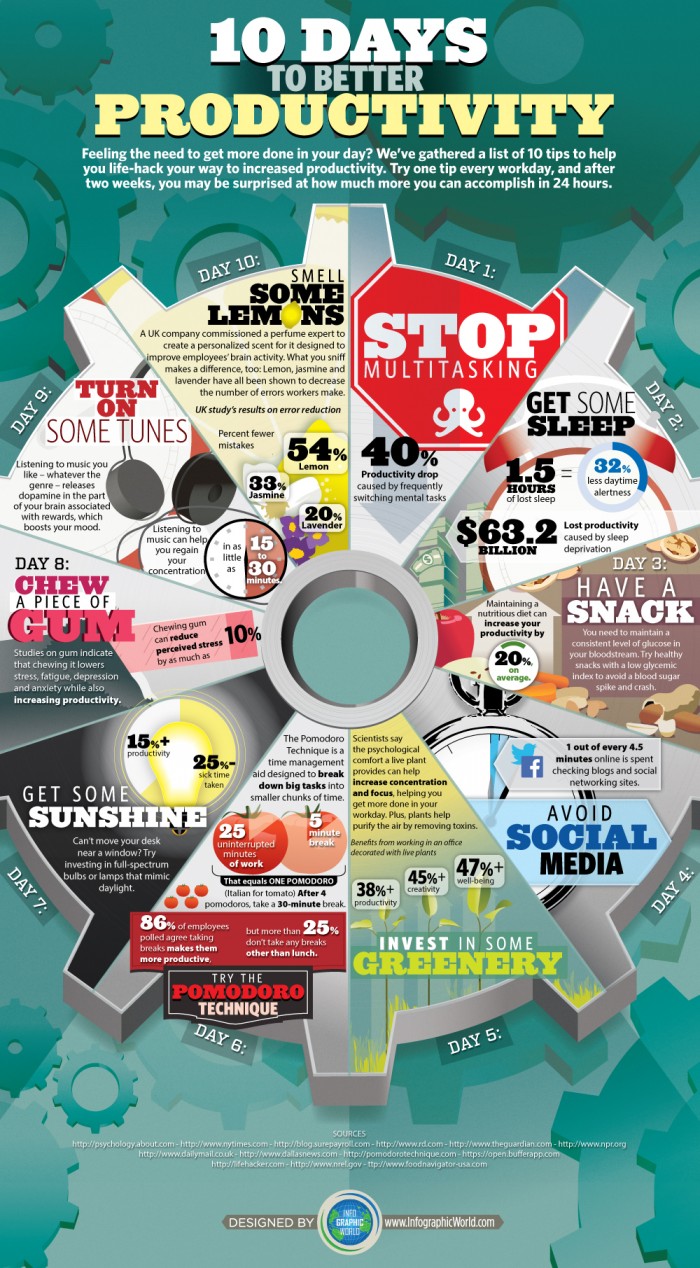
10 Days to Better Productivity
Stop. Multi-tasking. Just stop. The switching costs are too huge. While it feels like you’re getting a lot done, your likely damaging your overall results. This, and 9 other tips are laid out in this productivity infographic.
The Real Cost of Productivity
How much time do you actually spend working on your business? How about your employees? This infographic explore how much time we actually spend working, how much time we spend thumb-twiddling, and how expensive the latter is.
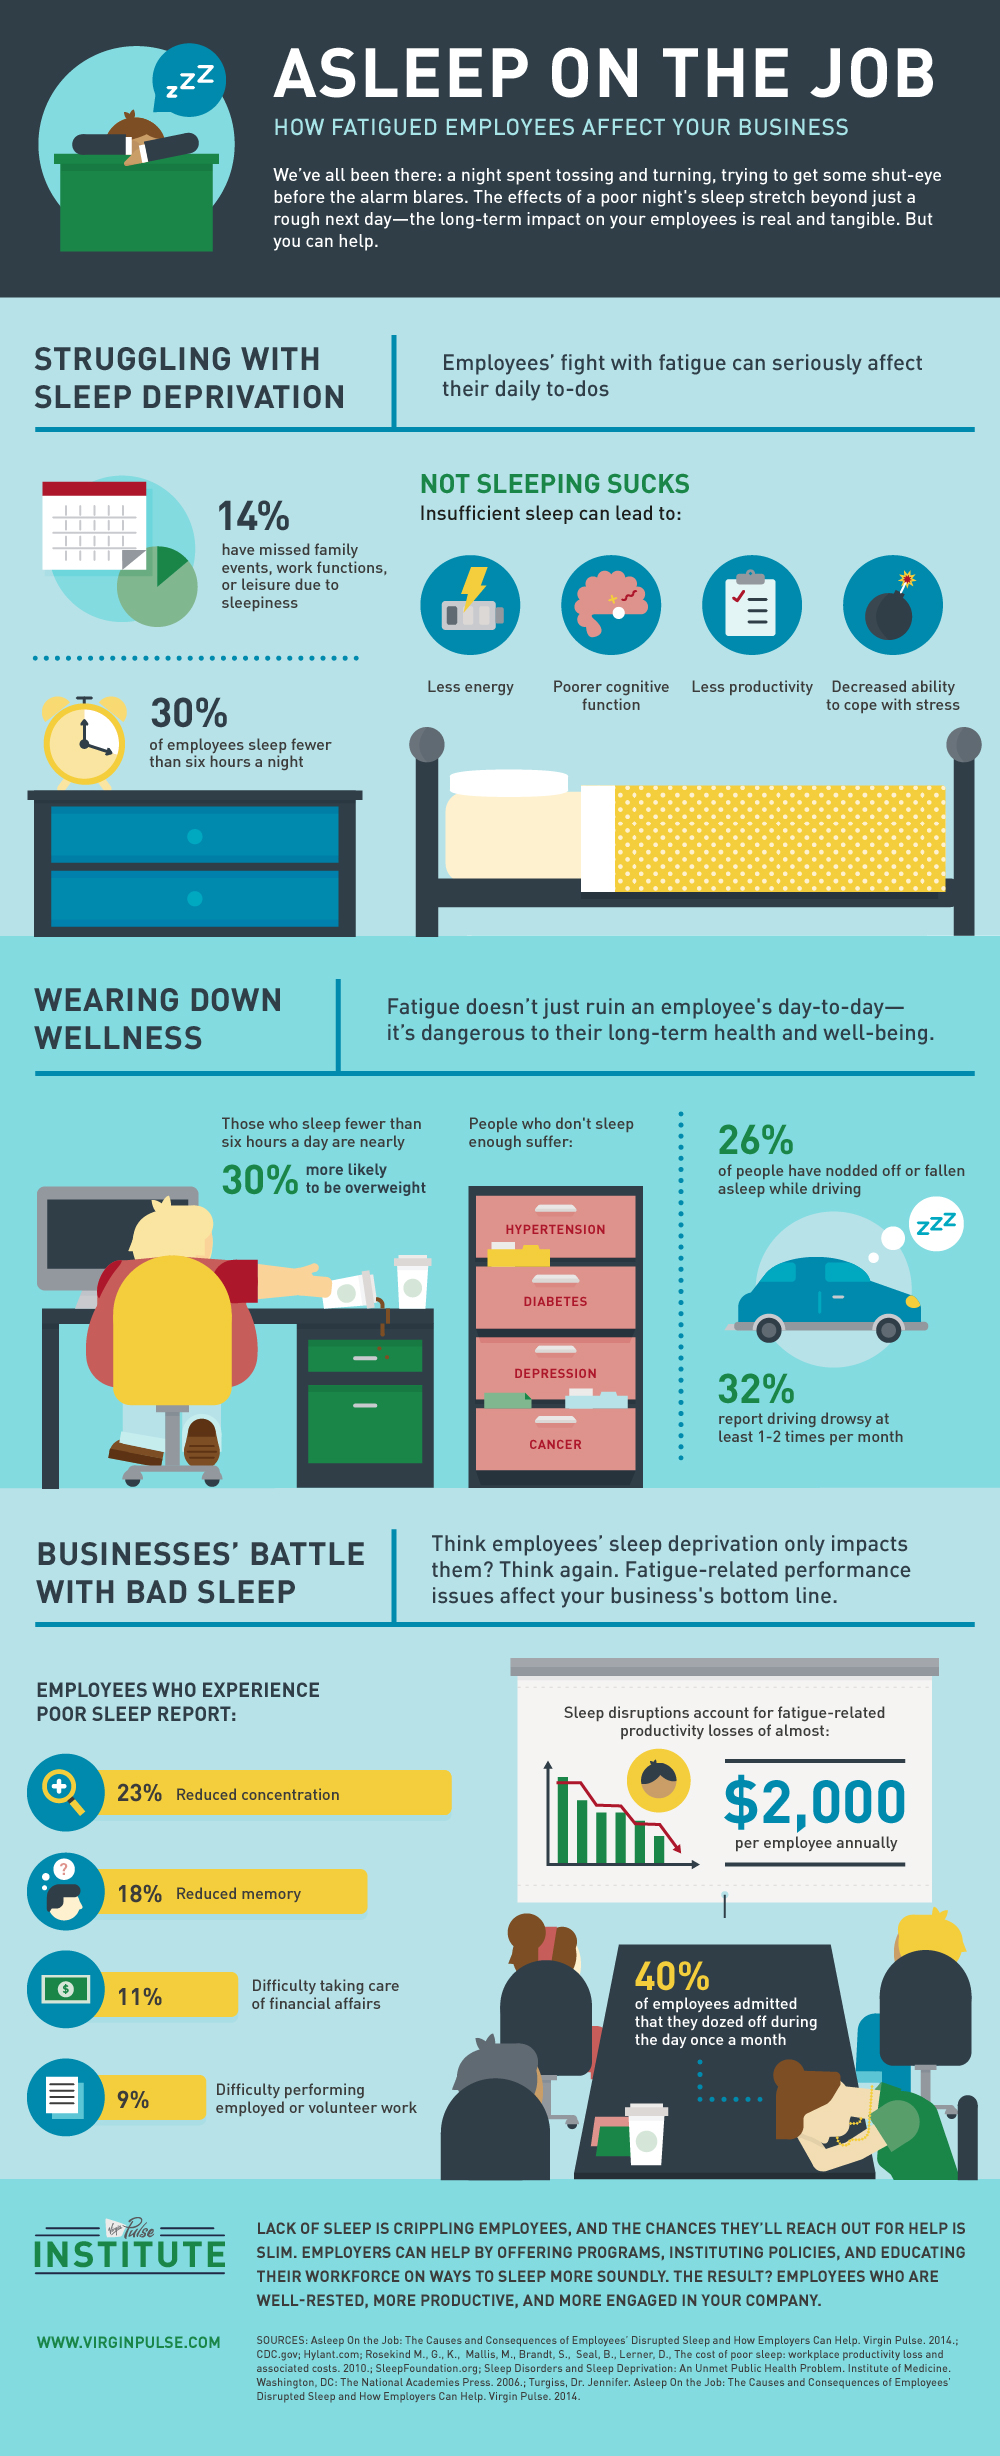
How Fatigued Employees Affect Your Business
Unfortunately, there’s an unhealthy obsession in the startup world with sleeping less. Sleep less, work more right? Not so fast. Studies have shown that not getting enough sleep can kill your productivity and actually make you less useful at work. Yikes!
Working Endless Hours Does Not Make You a Hero
Instead of working longer and longer hours, get more out of your day. It turns out, your workday doesn’t have to be all that long in order to accomplish great things.


